Creating an Immersive Physical Data Visualization With Real-Time Data
A 2-meter LED sphere, real-time data, and web tech: how we created an immersive physical data visualization.

By Wesley Grubbs, Kristin Baumann, and Nick Harbaugh.
Foreword by Kristin
When Wesley approached me about working on a visual installation with a massive 2-meter sphere, I knew this would be no ordinary project. I wanted to create a physical data visualization for quite some time, so I was very excited about the opportunity to work with Wesley and Nick to make this project a reality.
Most of the time in my freelance work as a Data Vis Developer, I am responsible for data handling on the backend side and visual aspects on the frontend. But with an extensive real-time data flow required and a short timeline, I was happy to focus primarily on the backend work in this project.
Aggregating data on stablecoins was really interesting, because the magnitude of the data points is just so unfathomable, being in the millions and billions. But the heart of the project for me evolved around the real-time events that allowed conference attendees to see their coffee purchases on the sphere within milliseconds. This immersive experience of a real-life action appearing in a visualized installation is what makes a real-time, physical data visualization so fascinating to me.
What follows is our collective account of how this project came to life.
Interested in bringing your data to life with a custom, interactive visualization? Get in touch!
hello@kristin-baumann.com | LinkedIn
The Vision
The stablecoin area at Stripe Sessions needed something that would not only draw attention but also demonstrate the dynamic, fluid nature of digital currency in an intuitive, visually striking way. A standard screen wouldn’t do — this called for something immersive and unexpected.
Enter the sphere: a perfect metaphor for the global, interconnected nature of digital currency. The team’s task was to transform this blank canvas into a living, breathing visualization of stablecoin transactions and data flows.
As lead creative technologist, Wesley Grubbs spearheaded the project with a focus on bringing together the right team, establishing the technical architecture, and ensuring the creative vision could be realized within the constraints of both time and technology. The goal was ambitious: create visualizations that would wrap seamlessly around a sphere, respond to real-time transactions, and captivate conference attendees.
The Team Approach
What made this project particularly special was the collaborative approach. Each team member brought unique expertise:
Wesley Grubbs (Lead Creative Technologist): Wesley’s role encompassed project management, creative and technical direction, architecture design, and engineering oversight. He focused on bringing the collective vision to life while ensuring technical feasibility.
Kristin Baumann (Data Vis Developer): In this project, Kristin’s role revolved around data and the backend. After setting up the backend architecture, she primarily focused on querying and storing live stablecoin data as well as getting real-time events show up on the sphere within milliseconds.
Nick Harbaugh (Generative Visual Engineer): Nick led the design and development of the real-time generative visuals, crafting seamless animations that could wrap around the LED sphere and respond dynamically to live stablecoin activity. He developed custom spherical projection techniques using P5.js and Three.js, and collaborated onsite with LED technicians to optimize the visuals for the unique geometry and lighting of the physical installation.
Technical Architecture: Web Technologies on a Sphere
One of the most innovative aspects of this project was the decision to use entirely web-based technologies for a physical installation. This approach gave the team tremendous flexibility and allowed them to leverage familiar tools in new ways.
The tech stack included:
- React with Typescript: Frontend for our application
- P5.js: Creating dynamic, geometric animations that responded to data
- D3.js: Generating streamgraphs and handling complex data visualizations
- Three.js: For testing and development when they couldn’t access the physical sphere
- Motion (former Framer Motion): As animation library
- Express: Backend for our application
- Vercel: Deployment and hosting the application
- Postgres database on Supabase: For data storage
- Pusher: Enabling real-time communication between purchases and our application
The combination of these technologies allowed us to create a system that was both visually stunning and functionally responsive.
The Development Journey
Initial Research and Testing
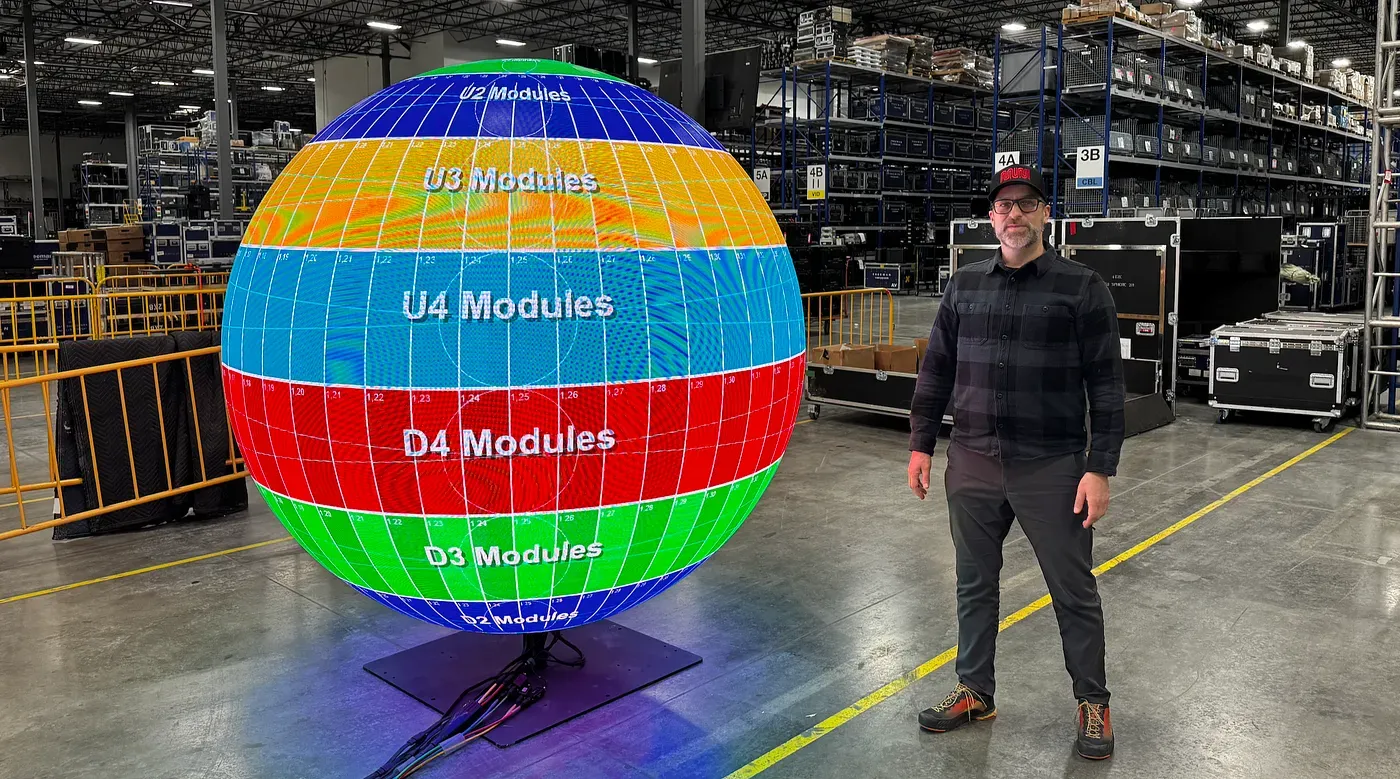
The project began with Wesley’s trip to Dallas to see the sphere in person. This was crucial — the team needed to understand exactly how visuals would wrap around the curved surface, how lighting would affect perception, and what technical constraints they might face.
During that visit, Wesley tested various visual concepts directly on the sphere, which proved invaluable in guiding their subsequent development. The team quickly learned that certain patterns and movements worked better than others in the spherical format.
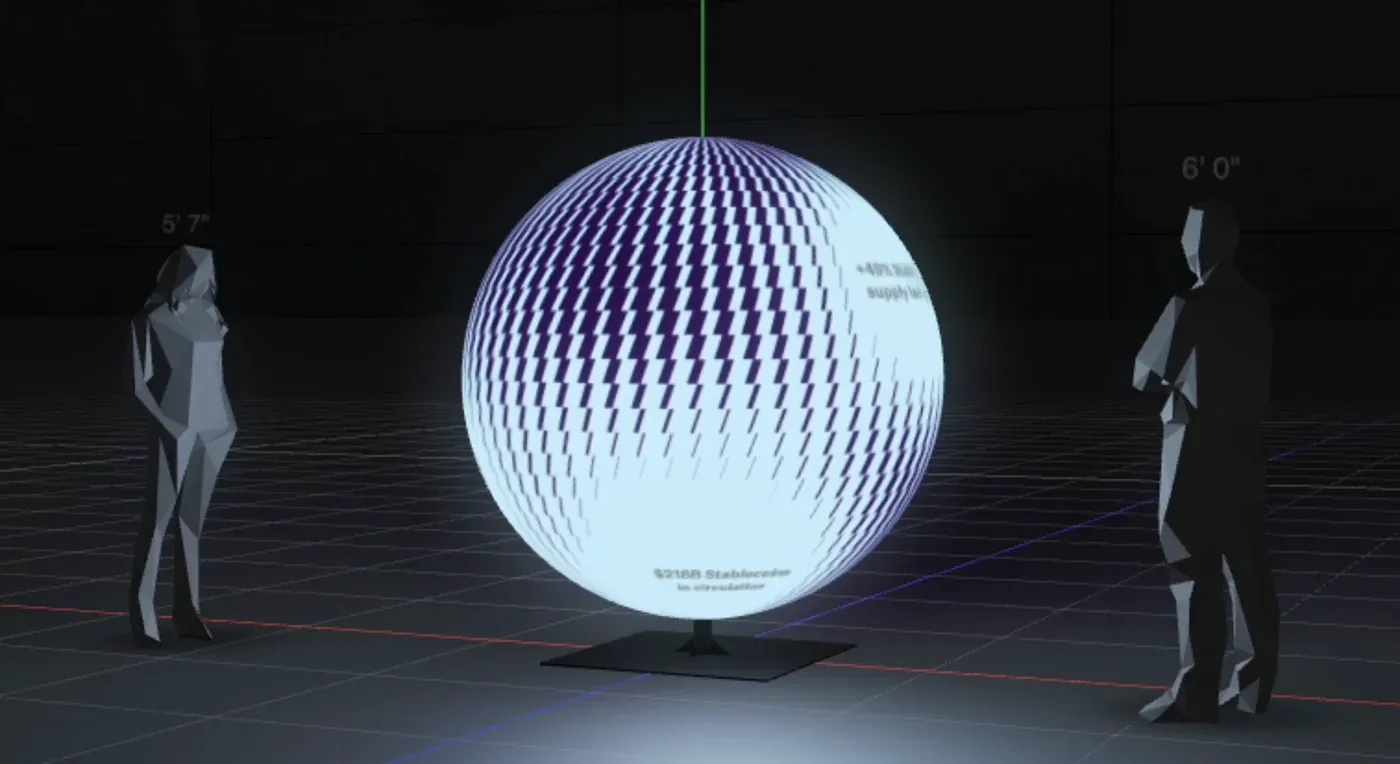
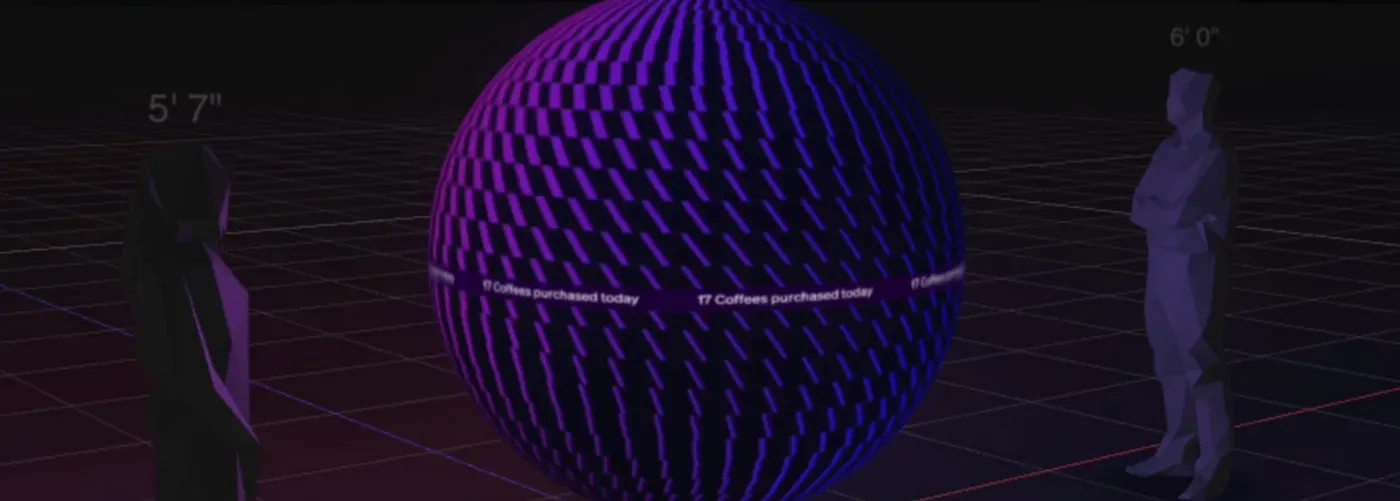
Building the Experience Without a Sphere
After the Dallas trip, the team faced a significant challenge: they no longer had access to the physical sphere for testing. This meant they needed to create their own virtual testing environment.
They built a custom Three.js testing environment that simulated how their visuals would appear on the sphere. This allowed them to iterate quickly without needing to be physically present with the hardware. The virtual sphere became their constant companion throughout development, helping them refine their animations and interactions.
The physical sphere itself belonged to events company Freeman, who also provided us with a simulated environment to display the sphere.
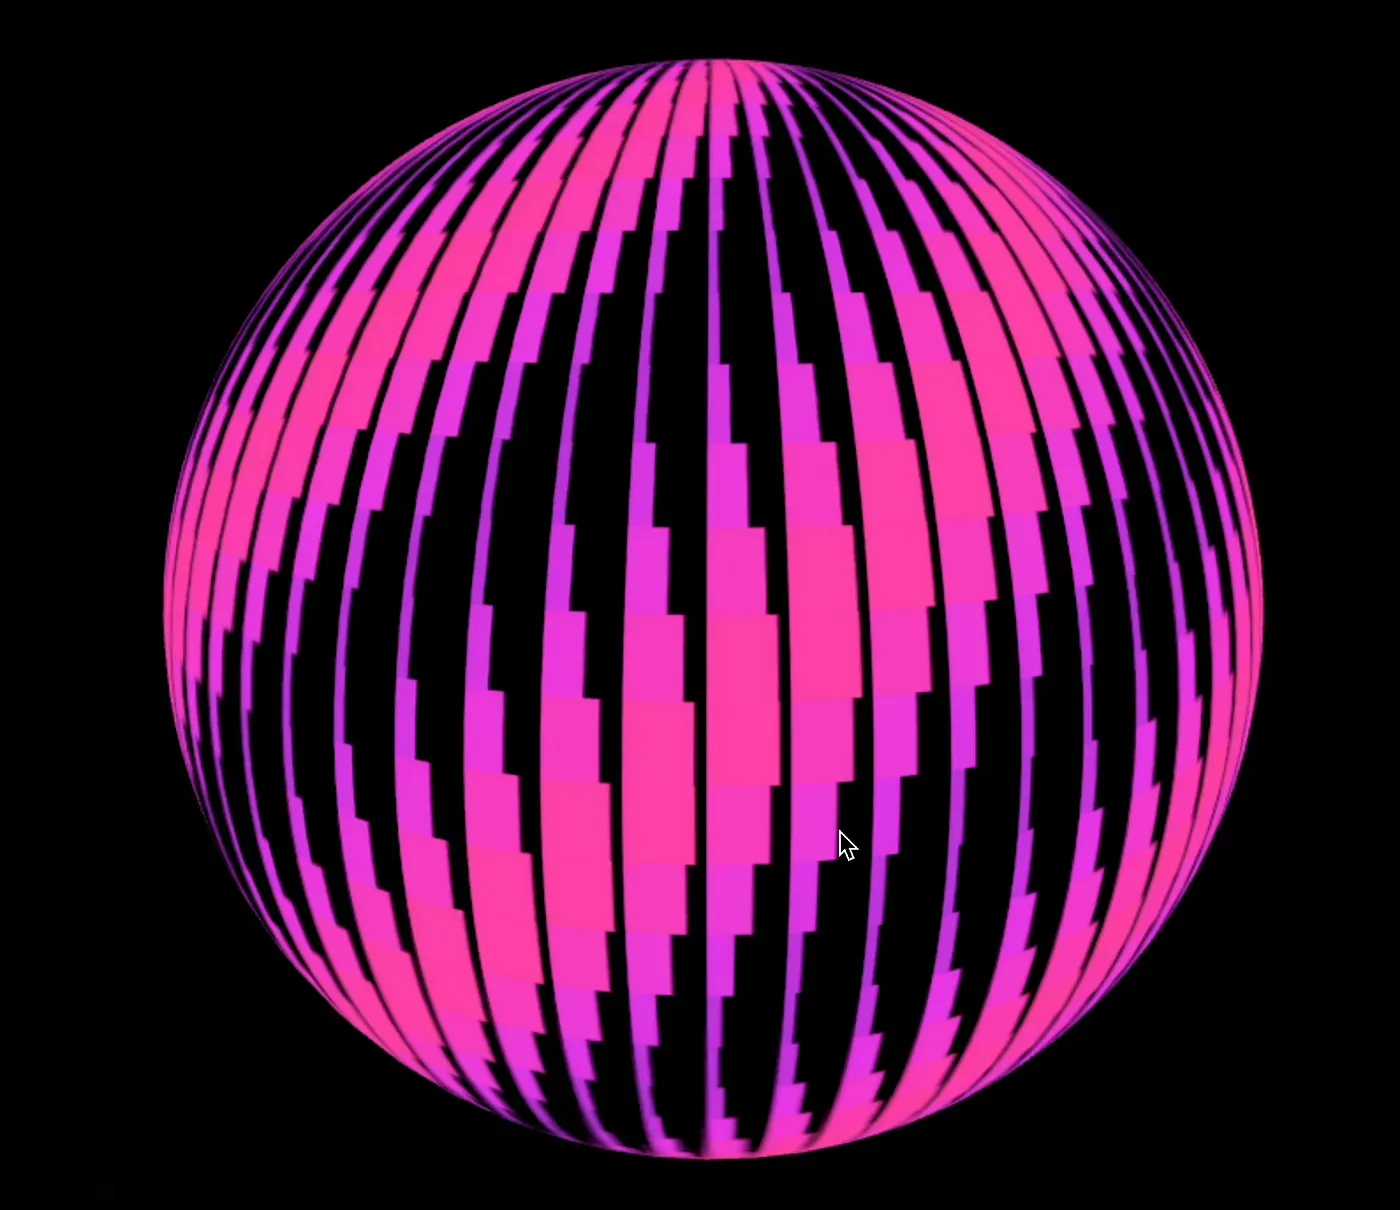
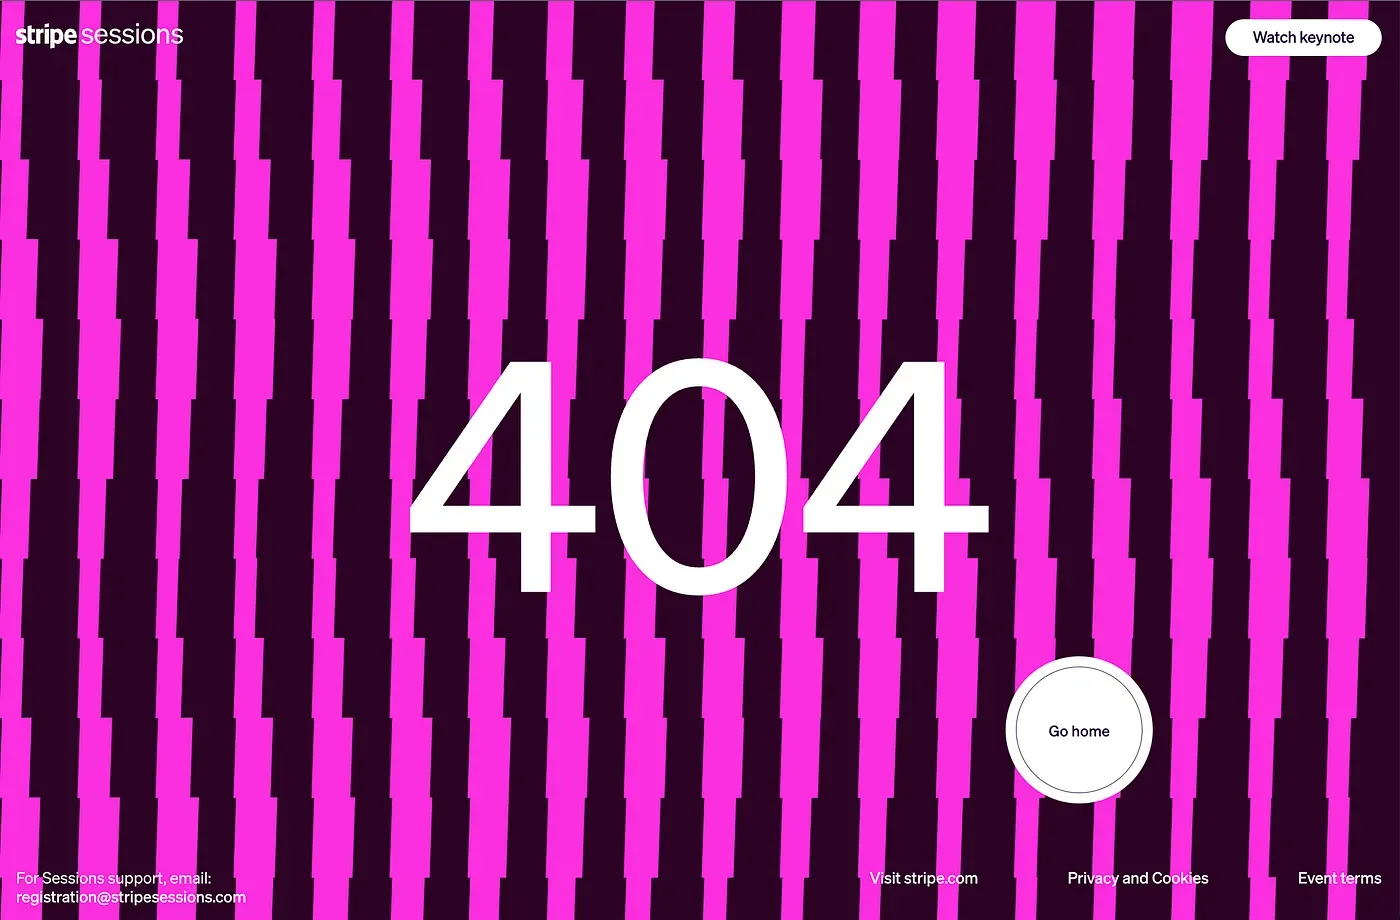
Design Inspiration
Interestingly, the visual direction was inspired by an unlikely source: Stripe Sessions’s 404 page. This hidden gem featured geometric animations that perfectly captured the aesthetic they wanted — modern, dynamic, and subtly referencing the digital nature of cryptocurrency.
We expanded on this concept, creating a visual language that included:
- Flowing geometric patterns representing currency movement
- Dynamic streamgraphs visualizing transaction volumes
- Reactive animations that responded to real-time stablecoin purchases
- Color schemes that reflected both Stripe’s brand and the digital currency space
Real-Time Data
What truly brought the sphere to life was its connection to real-world transactions. As the project showcased Stripe’s expanding focus on stablecoin technology, the team needed to gather real-time data on crypto transactions, specifically those involving stablecoins.
On the one hand, the sphere displayed data points such as the number of stablecoin transactions in the last hour; on the other hand, the conference attendees could purchase coffee using stablecoin, and each transaction would trigger unique visual effects on the sphere.
To query the stablecoin data, Kristin used the Allium API, an extensive blockchain data platform, to continuously query the data points via a cron job and store them in a Postgres database.
In order to display the live coffee purchases, Kristin built upon Stripe’s webhook feature. Every time a conference attendee bought a coffee with a stablecoin crypto wallet, the Stripe webhook was triggered in the Express backend. The purchase was then saved to the database and a real-time event was pushed to the React frontend via Pusher, a service for real-time features.
Testing this coffee purchase flow before the actual conference was crucial, so Kristin built an extensive testing mechanism to simulate coffee purchases.
Technical Challenges and Solutions
The Spherical Canvas Problem
One of the biggest technical challenges we faced was adapting web technologies — originally designed for flat screens — to a fully spherical display. Traditional web-based visualizations don’t naturally wrap around curved surfaces, and distortion can become a significant issue.
To address this, we built a custom Three.js development environment featuring a UV-mapped sphere that simulated how visuals would appear on the physical LED surface. This virtual testing ground became essential, allowing us to rapidly prototype animations, identify distortion, and refine motion behavior without needing constant access to the hardware.
With this setup, we focused on developing generative patterns that felt seamless and immersive from every angle. Using P5.js, we implemented noise loops, sinusoidal wave functions, and grid-based animations that tiled cleanly in all directions — ensuring smooth visual continuity across the sphere with no visible seams.
Data Visualization in Three Dimensions
Another challenge was rethinking data visualization for a three-dimensional space. Conventional charts and graphs don’t translate well to spherical surfaces, so the team had to develop new approaches.
Their solution involved:
- Creating custom projections for D3 visualizations
- Using P5.js to generate animations that could adapt to the curvature
- Developing visualization techniques that worked from multiple viewing angles
- Carefully calibrating movement speeds to prevent visual discomfort
- Build for seamless, around-the-sphere visuals where the seam was not visible
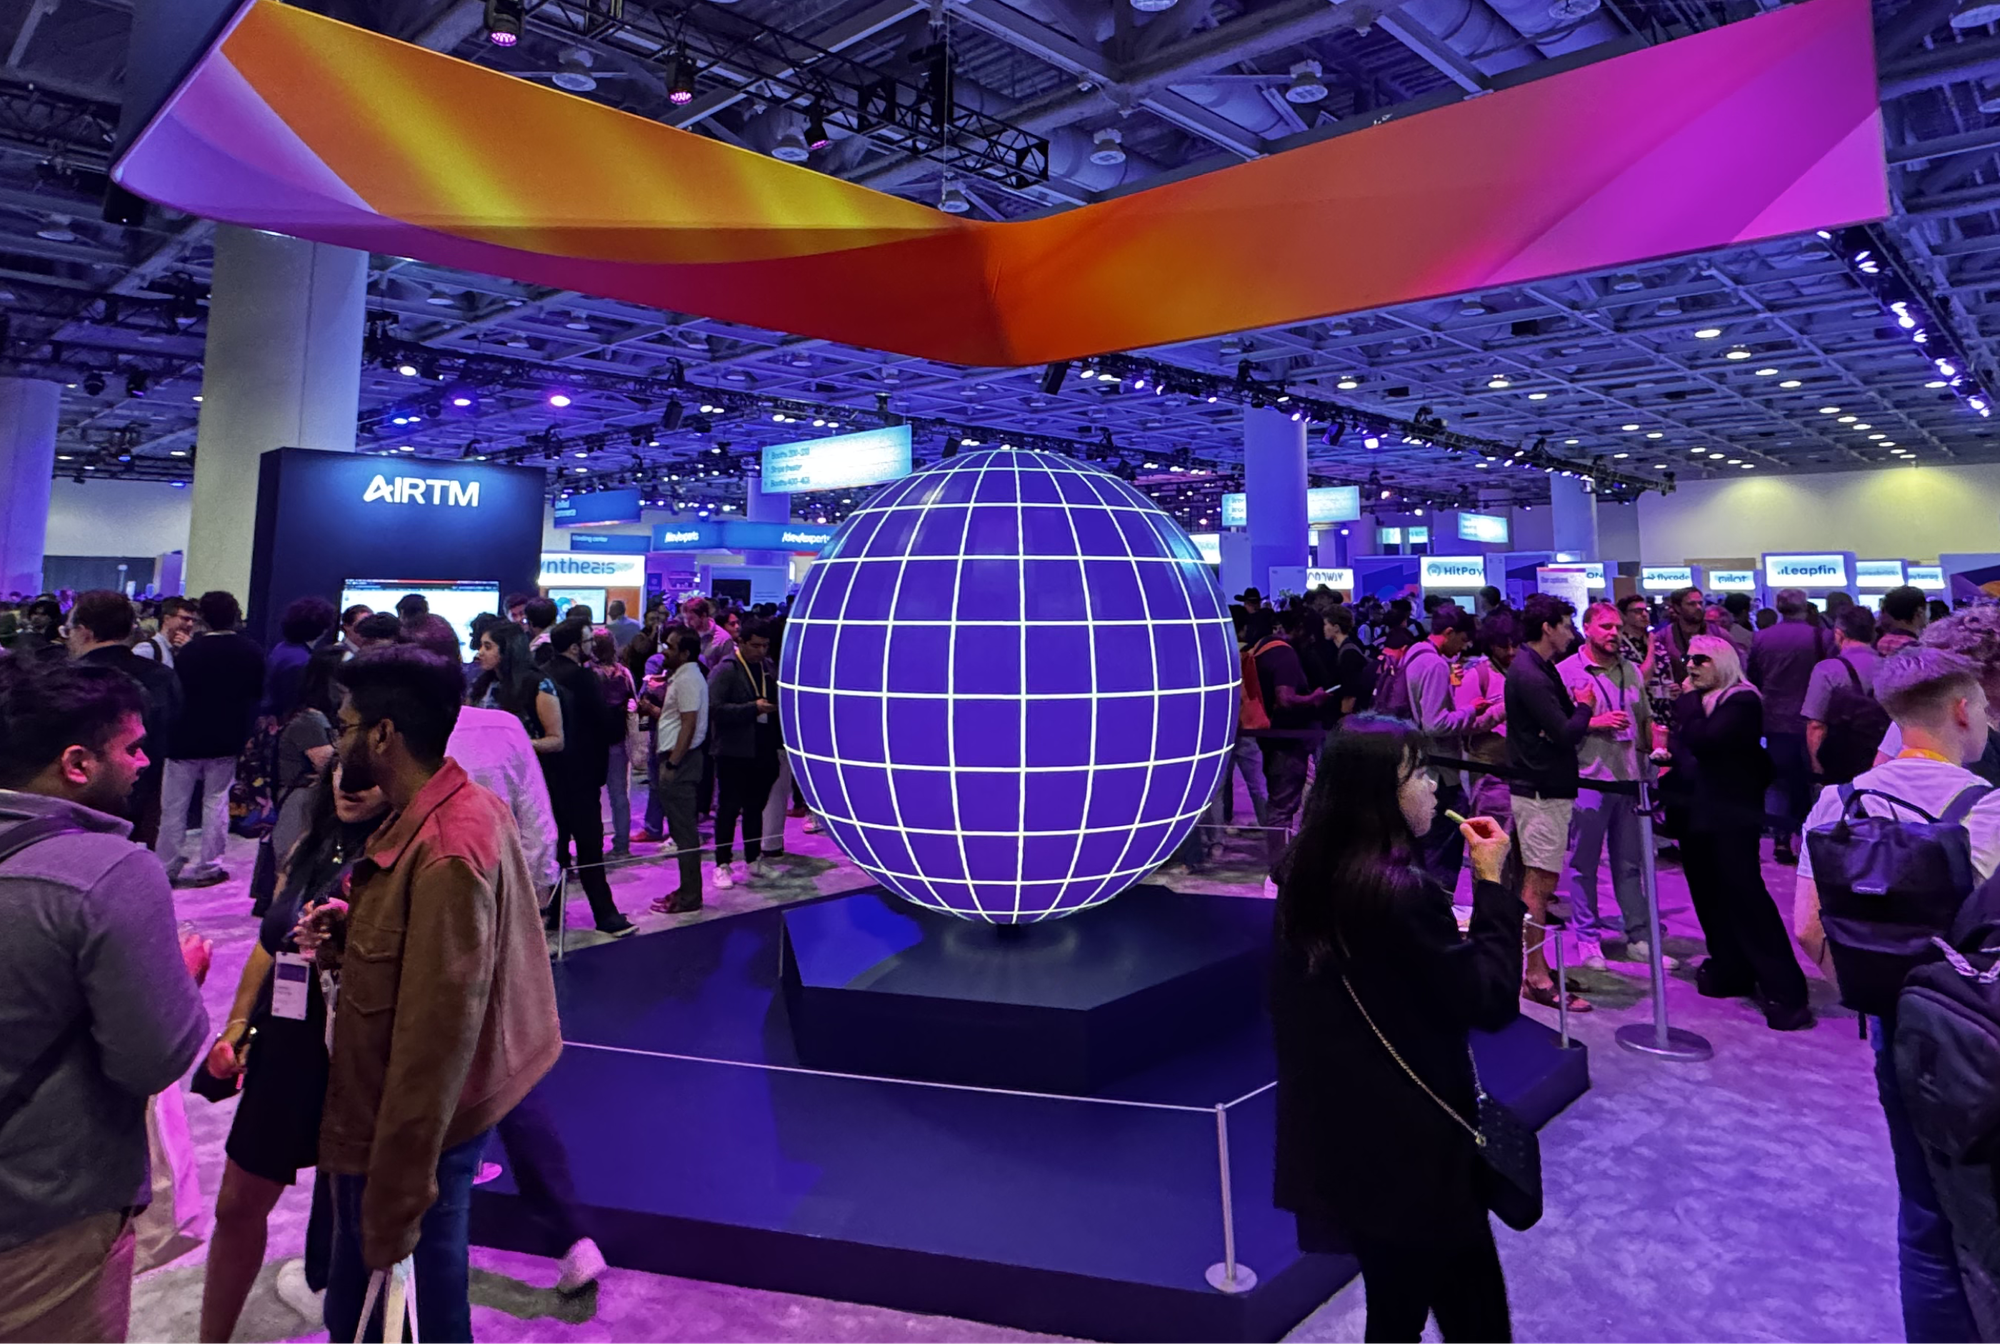
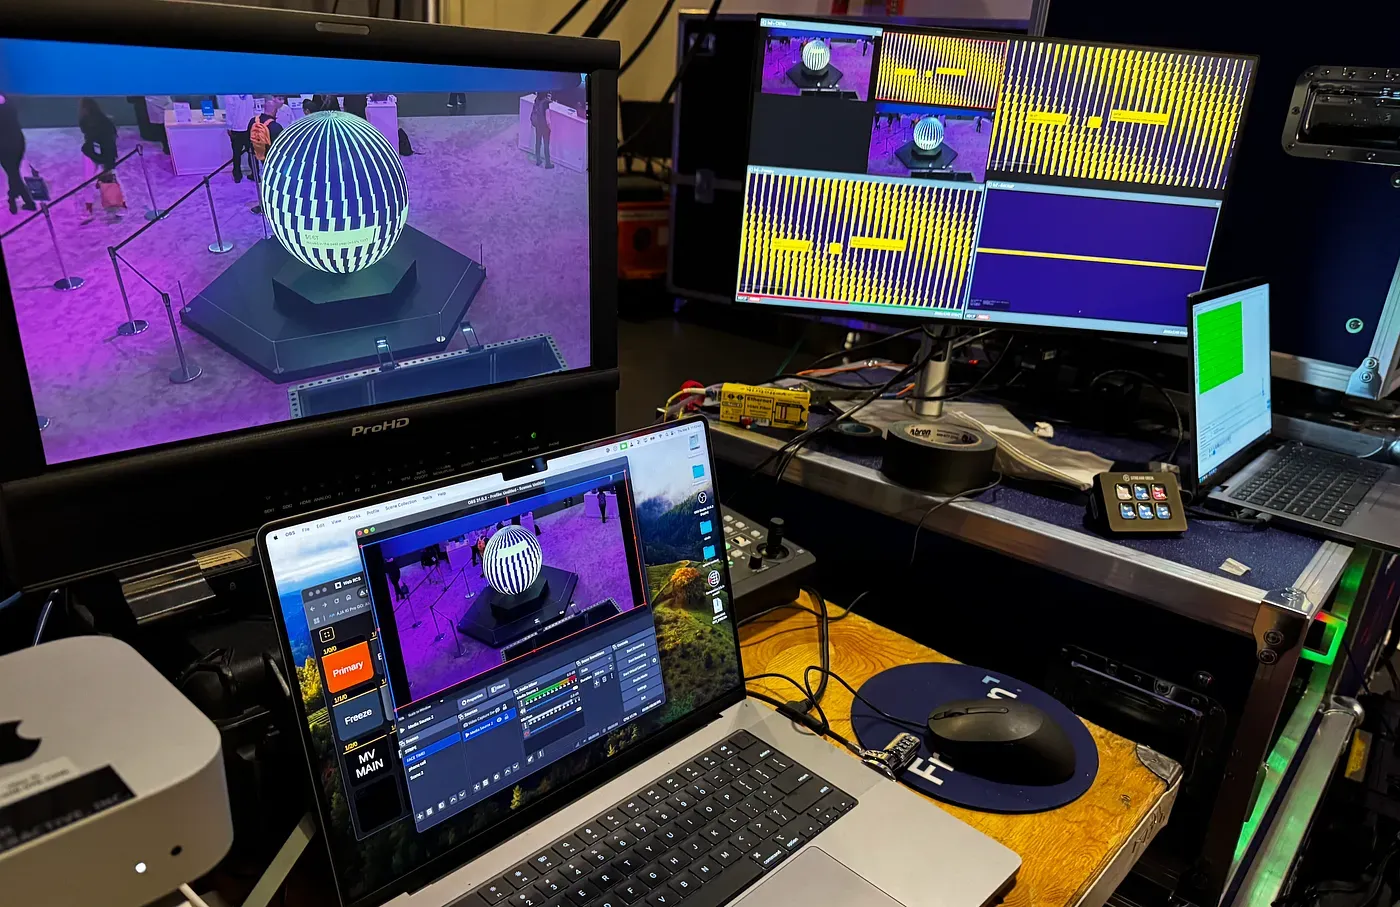
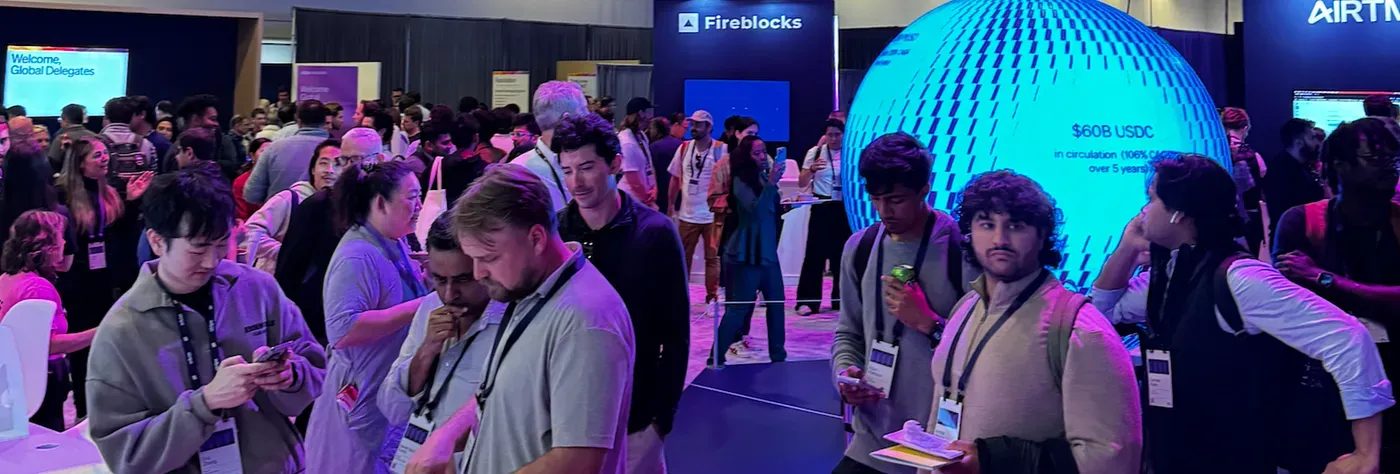
The Final Installation
After seven weeks of intensive development, the sphere made its debut at Stripe Sessions’ Expo floor. Positioned prominently in the stablecoin area, it immediately became a focal point for attendees.
Time-lapse video of the visual installation during the conference
The installation successfully achieved the team’s goals:
- Drawing attention to Stripe’s stablecoin initiatives
- Visualizing complex financial data in an intuitive, captivating way
- Demonstrating how web technologies can extend beyond traditional screens
Lessons Learned
This project pushed the team to think differently about web technologies and their applications in physical space. Some key takeaways include:
- Early testing is crucial: The initial trip to Dallas proved invaluable in understanding the medium.
- Simulation saves time: Developing in a virtual testing environment allowed the team to iterate rapidly.
- Web technologies are more versatile than they appear: Standard web tools can create extraordinary physical installations when used creatively.
- Cross-disciplinary collaboration is powerful: Combining expertise in design, data visualization, and engineering led to a more comprehensive solution.
Looking Forward
The sphere installation at Stripe Sessions represents what’s possible at the intersection of web technologies, data visualization, and physical space.
The team is excited to see how these techniques might be applied to future projects, and how the blending of digital and physical experiences will continue to create new possibilities for immersive storytelling.
Nick’s Closing Thoughts: This project reminded me how powerful it can be when creative technology lives both on-screen and in the physical world. Working with a large LED installation forced me to think spatially, test rigorously, and collaborate closely with hardware experts — something I found deeply rewarding. I hope the visuals not only sparked curiosity about Stripe’s stablecoin initiatives, but also inspired people to imagine new ways to bring code to life in physical environments.
About the Authors
Wesley Grubbs is a creative technologist specializing in innovative digital experiences at the intersection of data, design, and technology. LinkedIn | wesleygrubbs.com
Kristin Baumann is a freelance Data Viz Developer specializing in creating custom, interactive data visualizations. LinkedIn | kristin-baumann.com
Nick Harbaugh is a creative technologist and front-end engineer specializing in generative design, immersive installations, and data-driven experiences. LinkedIn | nickharbaugh.com