How to Embed a Custom D3 Chart in Webflow
A complete guide to adding custom D3 charts in Webflow. Learn how to code, host, and seamlessly integrate visualizations for dynamic websites.


Webflow is a powerful platform for building visually stunning websites without the need for coding expertise and with many high quality templates to get started. However, there may come a time when you want to go beyond Webflow's built-in capabilities and add your own custom elements, such as interactive charts. In this blog post, I'll walk through how to embed your custom-coded charts in Webflow.
When do you need a custom chart?
While Webflow is capable of handling many design needs, it doesn’t have built-in tools for creating complex, interactive charts. If you’re working on a data-heavy project or want to include a dynamic chart that updates or allows user interaction, you’ll need to turn to custom coding. JavaScript libraries like D3.js are excellent for creating highly customizable and interactive charts. It allows you to visualize data in unique ways, from bar graphs and line charts to more advanced visualizations like tree maps or network graphs.
Side note: When you want to create a chart without coding
If you're looking for a solution to create a chart without coding, you can use tools like Tableau, PowerBI, and Flourish. These tools provide export options where a short snippet of code is provided which you can then paste into a custom code embed in Webflow. With this method, you're limited to the chart capabilities of the mentioned tools and cannot create a truly custom chart.
👉 If you are looking for a custom data visualization that the standard chart tools cannot provide, I am happy to support you with my freelance work as a Data Visualization Developer. Get in touch here.
Overview
You need 4 steps to embed your custom chart:
- Creating the chart container in Webflow
- Coding the custom chart
- Hosting the chart script file
- Importing the script file in Webflow
Step 1: Creating the chart container in Webflow
First, you want to have the space for your future chart by creating the container in Webflow. In your Webflow designer, add a new element with the type Div Block and give it a specific id via the Element settings.
Creating a new div element and setting the element id
Step 2: Coding the custom chart separately
Now comes the fun part: coding your visualization. The possibilities for what you can create and how to code it with JavaScript are endless. There is only one important thing: In the end, you need to have one JavaScript file that populates the chart container DIV element.
This could look like this with D3:
const svg = d3
  .select("#chart-container")
  .append("svg")
...
Select the chart container and append a new SVG element. Then you add all your chart code inside that SVG.
Here you can find a more elaborate example:
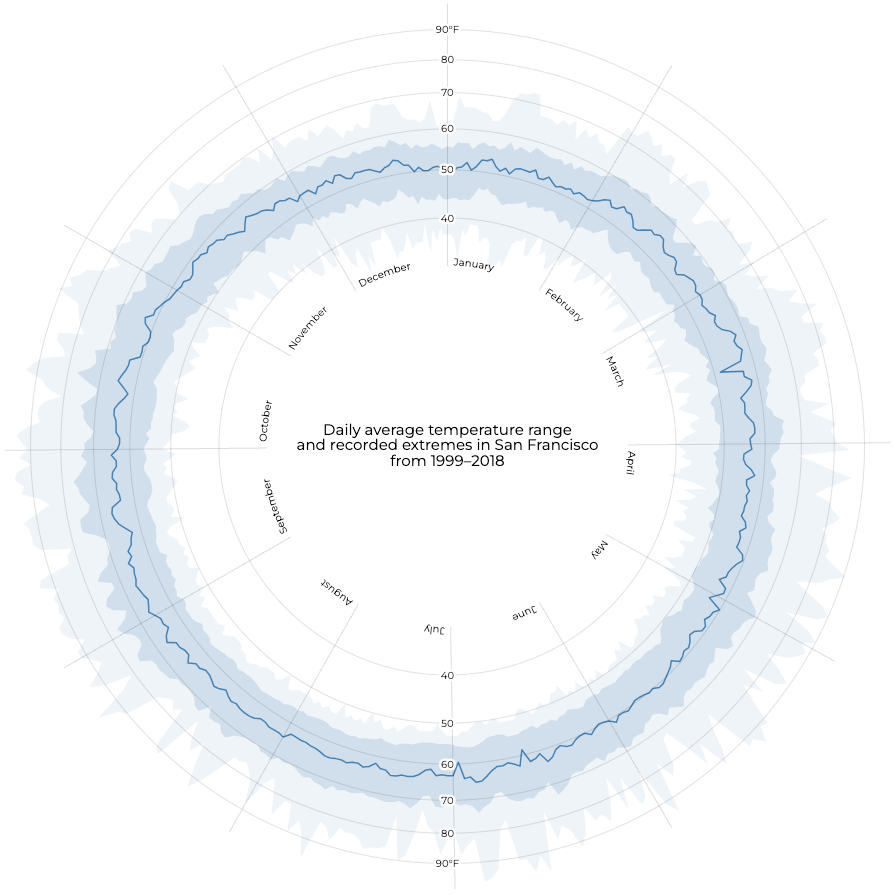
GitHub: https://github.com/kristinbaumann/example-how-to-embed-custom-charts-in-webflow
Tip: Use a test HTML page for developing your script
You can create a minimal HTML file which imports the script file. Then you're easily able to test the changes locally as well as in your deployed environment, as described in the next step.
See such a test HTML page here.
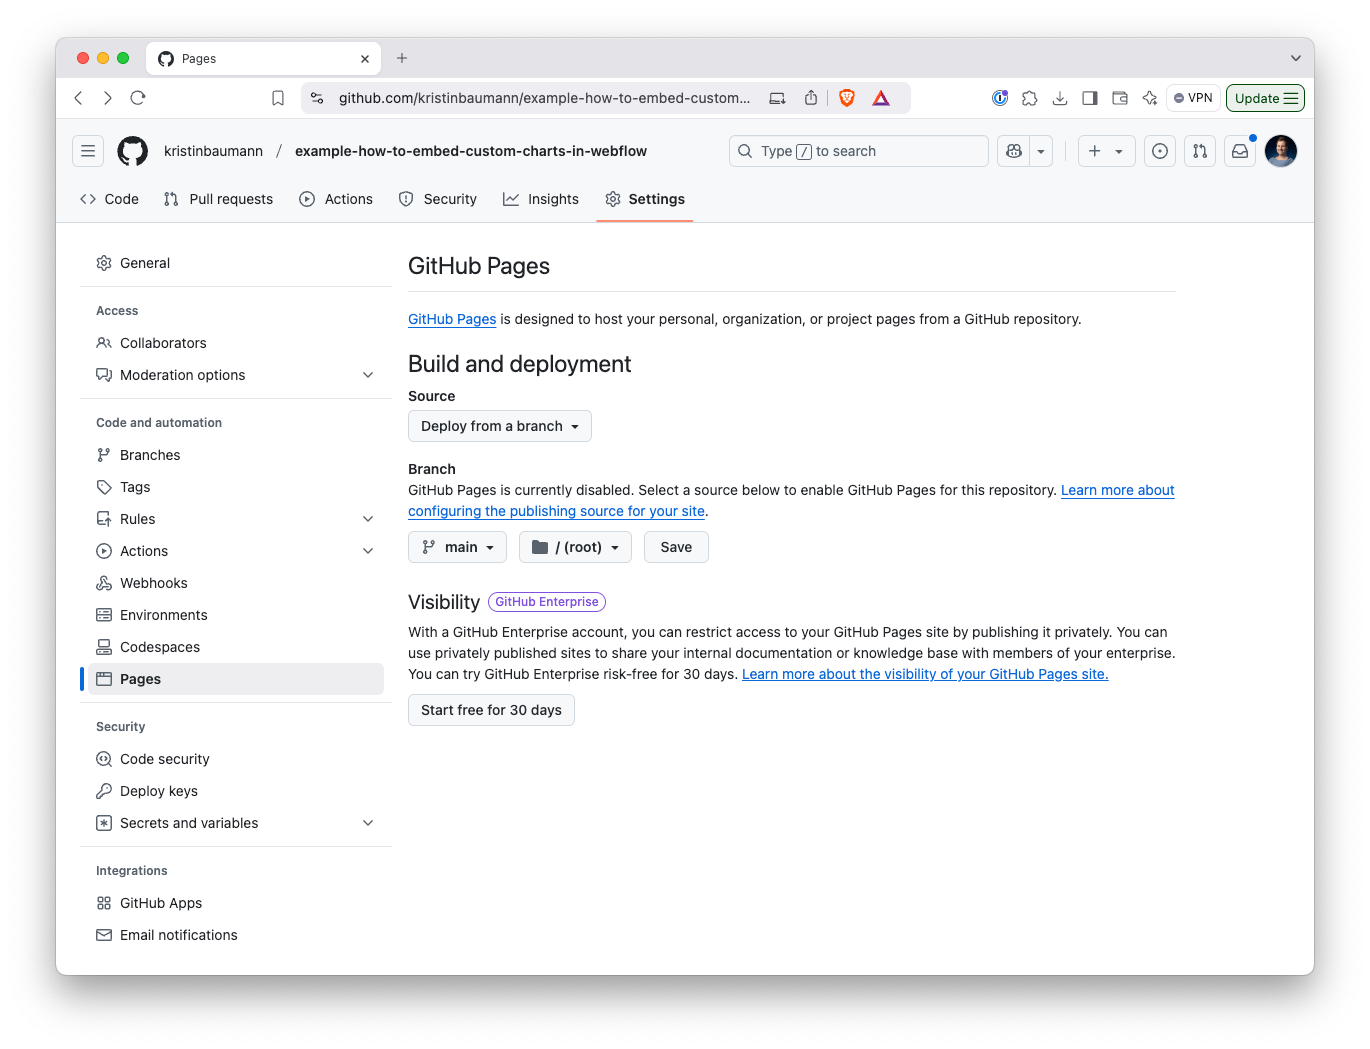
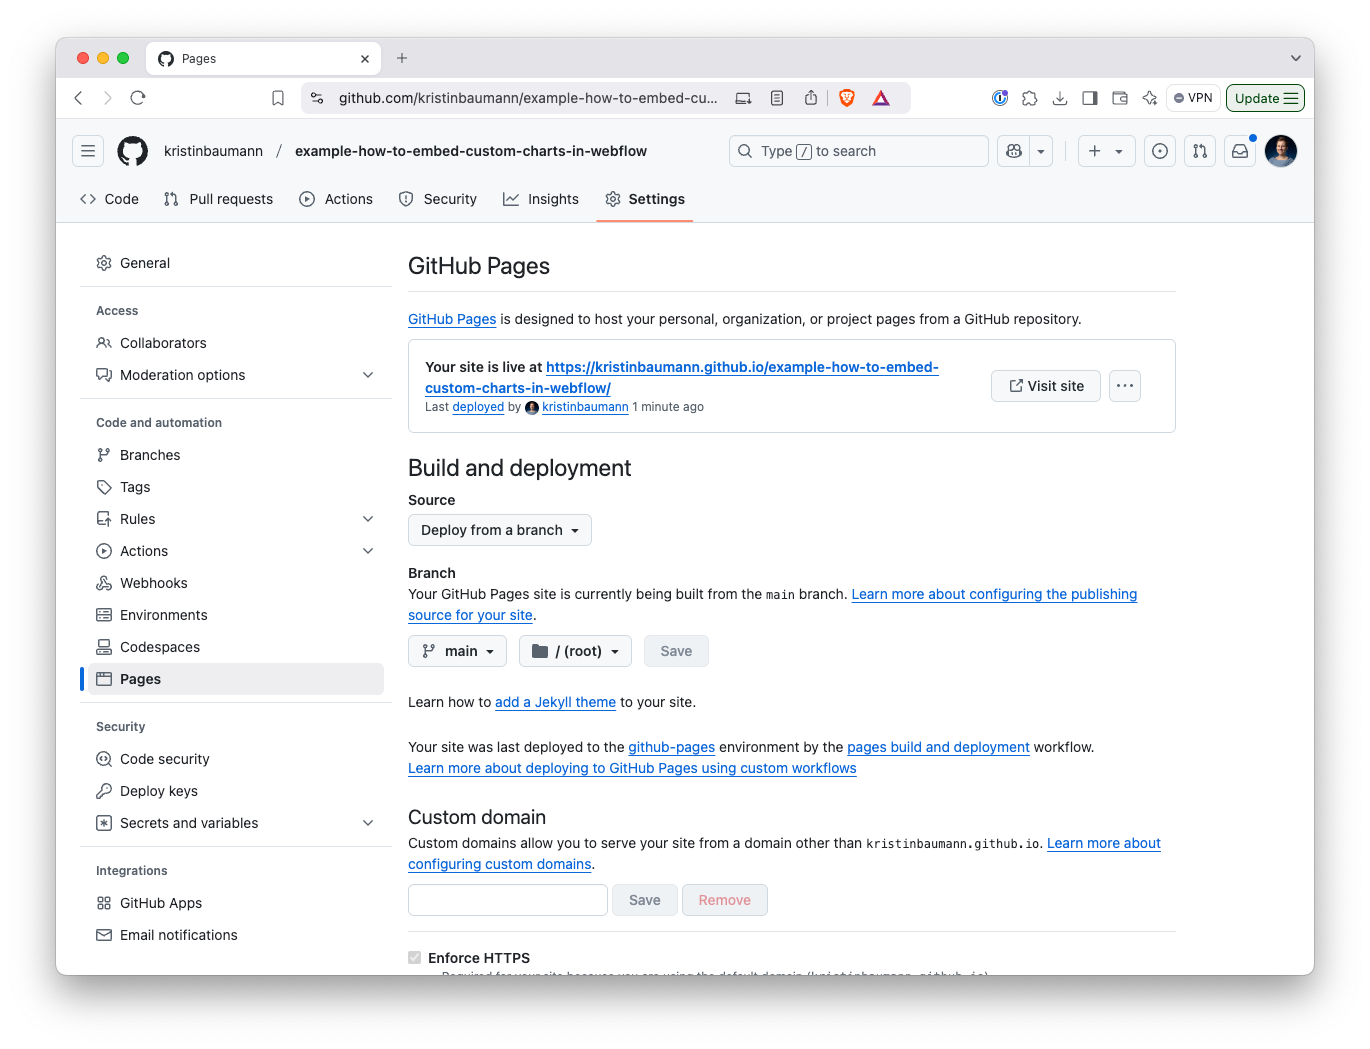
Step 3: Hosting the chart script file
Once you're happy with your custom chart, it's time to host it somewhere so you can access the script file from Webflow. This blog post describes the method with the free GitHub version, but the same principles apply to many other hosting providers as well.
- Create a public GitHub repository for your chart
- Deploy your code with GitHub pages
- Copy the URL to your raw script file
For the example repository, that's https://kristinbaumann.github.io/example-how-to-embed-custom-charts-in-webflow/script.js.
Step 4: Importing the script file in Webflow
Now let's finish the last step back in Webflow and populate the empty chart container from step 1 with your visualization. In your Webflow designer, navigate to the Custom Code section in our page settings and add two script tags in the Before </body> tag subsection:
<!-- Import D3 -->
<script src="https://d3js.org/d3.v7.min.js"></script>

<!-- Import chart script -->
<script src="... link to your raw script file from step 3 ..." async></script>
Remember to save the changes in the page settings and then (re-)publish your site. The custom code does not get executed in the Webflow designer, so you need to view the published site to see the custom chart in your website.
Video walk-through to add the scripts to your page
Other ways to add custom code to Webflow
You can add custom code to your Webflow project in different ways:
- Via the Site settings: Then the code is executed on all pages in your site.
- Via the Page settings: The code is only executed on one specific page.
- With a Code Embed component: You can decide where to place that component in your markup and the code is executed directly there on that page.
In our case with one viz on a specific page, using the page settings with a placement of the custom code before the closing body tag is the best option. With this approach, we reduce the loading time of our page, not having to wait for the script to execute before the DOM is displayed.
It is also possible to copy your code directly in the Custom Code section. But there is no syntax checking and you have to save and re-publish the site to see the result of your changed code resulting in a limited developer experience. There is also a character limit of 50.000 characters for your custom code.
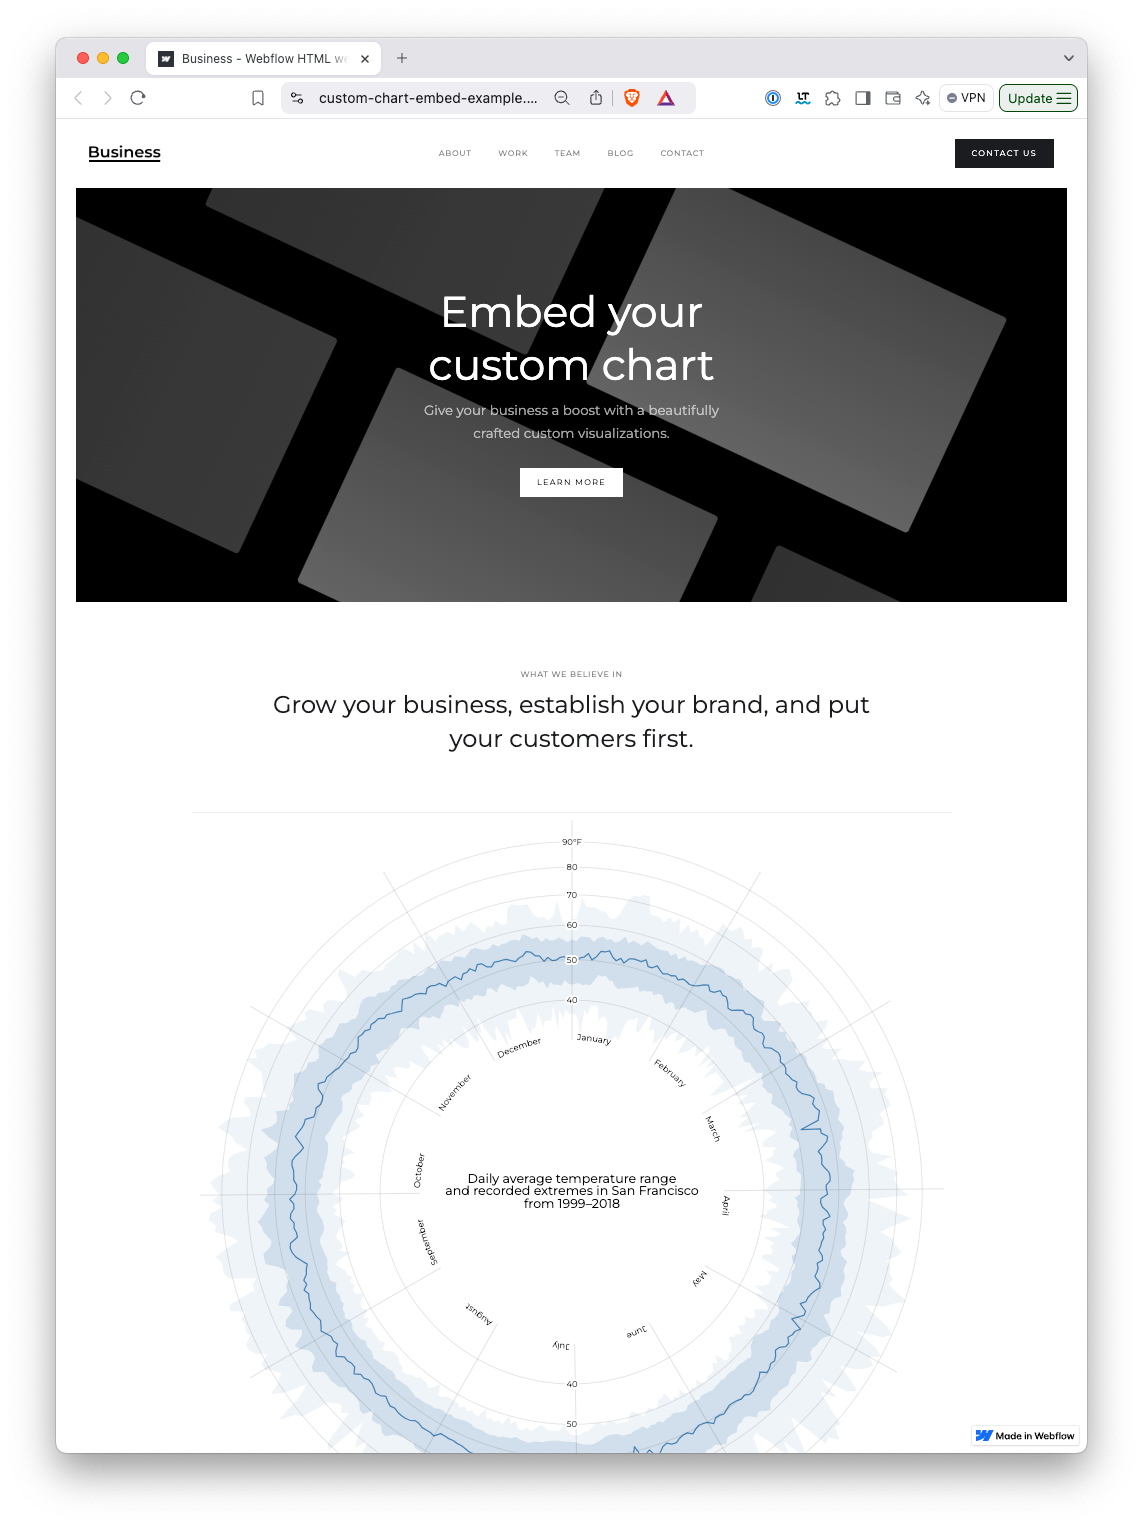
And done! 🥳
See the live Webflow site with embedded the chart here: https://custom-chart-embed-example.webflow.io/
When you want to edit the custom chart itself, you don't need to change or re-publish anything in Webflow. Just do your code edits, push to GitHub, wait for the GitHub pages deployment to finish and then reload your already published Webflow site.
Check out my “Childcare for All” data viz project to see an interactive D3 visualization embedded in an advanced Webflow site.